豆丁网
拖拽LOGO到书签栏收藏网站
权威考研资料库,备考必看
加入大会员,文档免费下
小学数学知识点精讲汇总
登录
注册
文档
专辑
用户
建筑
合同
报告
医疗
企业工具
按相关排序
按相关
最多阅读
最新上传
全部格式
全部格式
DOC
PDF
PPT
XLS
TXT
豆单
全部页数
全部页数
1-8页
9-100页
100页以上
时间不限
全部
2026年
2025年
2024年及以前
只看优质
展开
排序:
相关
最多阅读
最新上传
格式:
全部
doc
pdf
ppt
xls
txt
豆单
页数:
全部
1-8页
9-100页
100页以上
时间:
全部
2026年
2025年
2024年及以前
78
Producint
Graphs
with SAS
.pdf
PRODUCING GRAPHS WI TH SAS ElviraAgrn TASC/Advanced Support Team Center InformationTechnology Nation
a39d98be
热度:
顶
4
收藏到书房
立即下载
156
a modelica library for multibond
graphs
and its application in 3d-mechanics
.pdf
MasterThesisA Modelica Library MultiBondGraphsand its Application 3D-MechanicsDirkZimmerFebruary 200
d11c9793
热度:
收藏到书房
立即下载
6
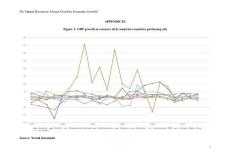
Graphs
.doc
GDPgrowth resourcerich countries (countries producing oil)Source: World DatabankFigure MineralRents
mail7que97
热度:
收藏到书房
立即下载
8
Bar
Graphs
and Line
Graphs
.ppt
Word Mail Merge
剑桥英文文档
热度:
收藏到书房
立即下载
46
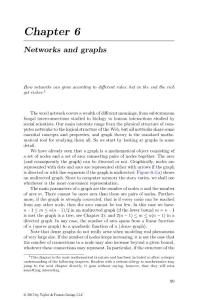
Networks and
graphs
.pdf
Chapter6Networks graphsHownetworks can grow according differentrules: richgetricher.1The word network
李萧萧
热度:
收藏到书房
立即下载
14
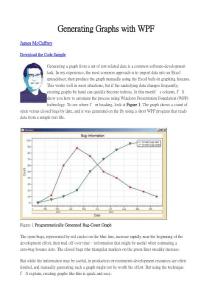
Generating
Graphs
with WPF
.doc
Generating a graph from a set of test-related data is a common software-development task. In my experience, the most common approach is to import data into an Excel spreadsheet, then produce the graph manually using the Excel built-in graphing features. This works well in most situations, but if the underlying data changes frequently, creating graphs by hand can quickly become tedious. In this month’s column, I’ll show you how to automate the process using Windows Presentation Foundation (WPF) technology.
csui
热度:
顶
2
收藏到书房
立即下载
13
3
Graphs
and functions
.pptx
functionsTheCartesian plane• X-axis horizontalline• Y-axis verticalline•• .Interpreting usinggraphs•
kivski
热度:
收藏到书房
立即下载
120
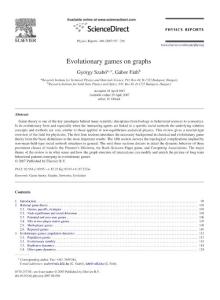
Evolutionary games on
graphs
.pdf
PhysicsReports 446 (2007) 97–/locate/physrepEvolutionary games graphsGyrgySzaba,,
56b292f6
热度:
顶
1
收藏到书房
立即下载
4
Five-coloring plane
graphs
.pdf
Five-coloringplane graphs Chapter 34Plane graphs coloringshave been intensiveresearchsince graphtheo
老男孩
热度:
顶
1
收藏到书房
立即下载
100
Community detection in
graphs
.pdf
Community detection in graphsCommunity detection in graphsCommunity detection in graphs
a37e7f03
热度:
收藏到书房
立即下载
升级豆丁大会员,13亿+文档免费下
更有在线复制文档、阅读零广告、专属客服等16项特权等你来
5万+用户已开通
1
2
3
4
5
6
7
8
9
10
11
向豆丁求助:有没有
graphs
?
95%
的用户最终下载了:
ppt
Bond-
Graphs
A Formalism for...
pdf
a new construction of broad...
pdf
efficient construction of b...
pdf
some new families of edge p...
相关搜索
bar
graphs
ept
graphs
gelfand
graphs
poker
graphs
regular
graphs
random
graphs
ielts
graphs
concept
graphs
如要投诉违规内容,请
联系我们
按需举报;如要提出意见建议,请到
社区论坛
发帖反馈。